|
Building the Matrix
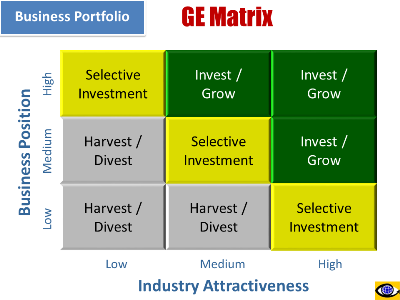
Each of the
organization’s strategic business units (SBUs)
is plotted on a matrix of two dimensions:
industry attractiveness and business
strength. Each of these two dimensions is,
actually, a composite of a variety of
factors.
① Industry
Attractiveness might be determined by
such factors as the rate of industry growth,
the number of competitors in an industry,
and the weakness of competitors within an
industry.
② Business
Strengths might be determined by such
factors as a company’s
core competencies,
resources and
capabilities, financially solid
position, its good bargaining position over
suppliers, and its high level of
technology use. |